Grafana is an open-source data visualization and monitoring tool that integrates with complex data from sources like Prometheus, InfluxDB, Graphite, and ElasticSearch. It lets you create alerts, notifications, and ad-hoc filters for your data while also making collaboration with your teammates easier through built-in sharing features.
In this tutorial, you will install Grafana and secure it with an SSL certificate and an Nginx reverse proxy. Once you have set up Grafana, you’ll have the option to configure user authentication through GitHub, allowing you to better organize your team permissions.
Prerequisites
To follow this tutorial, you will need:
- One Ubuntu 20.04 server set up, including a non-root user with sudo privileges and a firewall configured with ufw.
- A fully registered domain name. This tutorial uses your_domain throughout. You can purchase a domain name on Namecheap, get one for free on Freenom, or use the domain registrar of your choice.
- The following DNS records set up for your server:
- An A record with your_domain pointing to your server’s public IP address.
- An A record with www.your_domain pointing to your server’s public IP address.
- Nginx set up, including a server block for your domain.
- An Nginx server block with Let’s Encrypt configured.
- Optionally, to set up GitHub authentication, you’ll need a GitHub account associated with an organization.
Matching infrastructure at centron
Hardening does not stop at the server: cloud firewalls filter traffic before it reaches the VM – centrally managed, no per-rule surcharge. Explore cloud firewalls →
Step 1 — Installing Grafana
In this first step, you will install Grafana onto your Ubuntu 20.04 server. You can install Grafana either by downloading it directly from its official website or by going through an APT repository. Because an APT repository makes it easier to install and manage Grafana’s updates, you’ll use that method in this tutorial.
Download the Grafana GPG key with wget, then pipe the output to apt-key. This will add the key to your APT installation’s list of trusted keys, which will allow you to download and verify the GPG-signed Grafana package:
wget -q -O - https://packages.grafana.com/gpg.key | sudo apt-key add -In this command, the option -q turns off the status update message for wget, and -O outputs the file that you downloaded to the terminal. These two options ensure that only the contents of the downloaded file are pipelined to apt-key.
Next, add the Grafana repository to your APT sources:
sudo add-apt-repository "deb https://packages.grafana.com/oss/deb stable main"Refresh your APT cache to update your package lists:
sudo apt updateYou can now proceed with the installation:
sudo apt install grafanaOnce Grafana is installed, use systemctl to start the Grafana server:
sudo systemctl start grafana-serverNext, verify that Grafana is running by checking the service’s status:
sudo systemctl status grafana-serverYou will receive output similar to this:
● grafana-server.service - Grafana instance
     Loaded: loaded (/lib/systemd/system/grafana-server.service; disabled; vendor preset: enabled)
   Active: active (running) since Thu 2020-05-21 08:08:10 UTC; 4s ago
     Docs: http://docs.grafana.org
 Main PID: 15982 (grafana-server)
    Tasks: 7 (limit: 1137)
This output contains information about Grafana’s process, including its status, Main Process Identifier (PID), and more. active (running) shows that the process is running correctly.
Lastly, enable the service to automatically start Grafana on boot:
sudo systemctl enable grafana-serverYou will receive the following output:
Synchronizing state of grafana-server.service with SysV service script with /lib/systemd/systemd-sysv-install.
Executing: /lib/systemd/systemd-sysv-install enable grafana-server
Created symlink /etc/systemd/system/multi-user.target.wants/grafana-server.service → /usr/lib/systemd/system/grafana-server.service.
Grafana is now installed and ready for use. Next, you will secure your connection to Grafana with a reverse proxy and SSL certificate.
Step 2 — Setting Up the Reverse Proxy
Using an SSL certificate will ensure that your data is secure by encrypting the connection to and from Grafana. But, to make use of this connection, you’ll first need to reconfigure Nginx as a reverse proxy for Grafana.
Open the Nginx configuration file you created when you set up the Nginx server block with Let’s Encrypt in the Prerequisites. You can use any text editor, but for this tutorial we’ll use nano:
sudo nano /etc/nginx/sites-available/your_domainLocate the following block:
/etc/nginx/sites-available/your_domain
...
location / {
    try_files $uri $uri/ =404;
}
...
Because you already configured Nginx to communicate over SSL and because all web traffic to your server already passes through Nginx, you just need to tell Nginx to forward all requests to Grafana, which runs on port 3000 by default.
Delete the existing try_files line in this location block and replace it with the following options:
/etc/nginx/sites-available/your_domain
...
location / {
   proxy_set_header Host $http_host;
   proxy_pass http://localhost:3000;
}
...
This will map the proxy to the appropriate port and will pass a server name in the header.
Also, in order for the Grafana Live WebSocket connections to work correctly, add the following section outside the server section:
/etc/nginx/sites-available/your_domain
map $http_upgrade $connection_upgrade {
  default upgrade;
  '' close;
}

server {
    ...
Then add the following location section to the server block:
/etc/nginx/sites-available/your_domain
server {
...
    location /api/live {
       proxy_http_version 1.1;
       proxy_set_header Upgrade $http_upgrade;
       proxy_set_header Connection $connection_upgrade;
       proxy_set_header Host $http_host;
       proxy_pass http://localhost:3000;
    }
...
The headers Upgrade and Connection are not sent from the client to the proxied server. Therefore, in order for the proxied server to know about the client’s intention to change the protocol to WebSocket, these headers should be passed explicitly.
The final configuration will look like this:
/etc/nginx/sites-available/your_domain
map $http_upgrade $connection_upgrade {
  default upgrade;
  '' close;
}

server {
    listen 80;
    listen [::]:80;

    root /var/www/your_domain/html;
    index index.html index.htm index.nginx-debian.html;

    server_name your_domain www.your_domain;

    location / {
       proxy_set_header Host $http_host;
       proxy_pass http://localhost:3000;
    }

    location /api/live {
       proxy_http_version 1.1;
       proxy_set_header Upgrade $http_upgrade;
       proxy_set_header Connection $connection_upgrade;
       proxy_set_header Host $http_host;
       proxy_pass http://localhost:3000;
    }
}
Once you’re done, save and close the file by pressing CTRL+X, Y, and then ENTER if you’re using nano.
Now, test the new settings to make sure everything is configured correctly:
sudo nginx -tYou will receive the following output:
Output
nginx: the configuration file /etc/nginx/nginx.conf syntax is ok
nginx: configuration file /etc/nginx/nginx.conf test is successful
Finally, activate the changes by reloading Nginx:
sudo systemctl reload nginxYou can now access the default Grafana login screen by pointing your web browser to https://your_domain. If you’re unable to reach Grafana, verify that your firewall is set to allow traffic on port 443 and then re-trace the previous instructions.With the connection to Grafana encrypted, you can now implement additional security measures, starting with changing Grafana’s default administrative credentials.
Step 3 — Updating Credentials
Start by navigating to https://your_domain from your web browser. This will bring up the default login screen.
Enter admin into both the Email or username and Password fields and then click on the Log in button.
On the next screen, change the default password by entering your new password into the New password and Confirm new password fields.
Click Submit to save the new information. If you skip this step, you will be prompted to change the password next time you log in.
With the connection to Grafana encrypted, you can now implement additional security measures, starting with changing Grafana’s default administrative credentials.
Step 4 — Disabling Grafana Registrations and Anonymous Access
Grafana provides options that allow visitors to create user accounts for themselves and preview dashboards without registering. When Grafana isn’t accessible via the internet or when it’s working with publicly available data like service statuses, you may want to allow these features. However, when using Grafana online to work with sensitive data, anonymous access could be a security problem. To fix this problem, you’ll make some changes to your Grafana configuration.
Start by opening Grafana’s main configuration file for editing:
sudo nano /etc/grafana/grafana.iniLocate the following allow_sign_up directive under the [users] heading:
/etc/grafana/grafana.ini
...
[users]
# disable user signup / registration
;allow_sign_up = true
...
Enabling this directive with true adds a Sign Up button to the login screen, allowing users to register themselves and access Grafana.
Disabling this directive with false removes the Sign Up button and strengthens Grafana’s security and privacy.
Uncomment this directive by removing the ; at the beginning of the line and then setting the option to false:
/etc/grafana/grafana.ini
...
[users]
# disable user signup / registration
allow_sign_up = false
...
Next, locate the following enabled directive under the [auth.anonymous] heading:
/etc/grafana/grafana.ini
...
[auth.anonymous]
# enable anonymous access
;enabled = false
...
Setting enabled to true gives non-registered users access to your dashboards; setting this option to false limits dashboard access to registered users only.
Uncomment this directive by removing the ; at the beginning of the line and then setting the option to false:
/etc/grafana/grafana.ini
...
[auth.anonymous]
# enable anonymous access
enabled = false
...
Save the file and exit your text editor.
To activate the changes, restart Grafana:
sudo systemctl restart grafana-serverVerify that everything is working by checking Grafana’s service status:
sudo systemctl status grafana-serverLike before, the output will report that Grafana is active (running).
Now, point your web browser to https://your_domain. To return to the Sign Up screen, bring your cursor to your avatar in the lower left of the screen and click on the Sign out option that appears.
Once you have signed out, verify that there is no Sign Up button and that you can’t sign in without entering login credentials.
At this point, Grafana is fully configured and ready for use. Next, you can simplify the login process for your organization by authenticating through GitHub.
(Optional) Step 5 — Setting Up a GitHub OAuth App
For an alternative approach to signing in, you can configure Grafana to authenticate through GitHub, which provides login access to all members of authorized GitHub organizations. This can be particularly useful when you want to allow multiple developers to collaborate and access metrics without having to create Grafana-specific credentials.
Navigating to GitHub Organization Settings
Start by logging in to a GitHub account associated with your organization and then navigate to your GitHub profile page.
Switch settings context by clicking on your name on the left side of the screen, then selecting your organization in the dropdown menu. This will switch context from Personal settings to Organization settings.
On the next screen, you’ll see your Organization profile where you can change settings like your Organization display name, organization Email, and organization URL.
Understanding OAuth for Grafana Authentication
Because Grafana uses OAuth—an open standard for granting remote third parties access to local resources—to authenticate users through GitHub, you’ll need to create a new OAuth application within GitHub.
Click the OAuth Apps link under Developer settings on the lower left-hand side of the screen.
If you don’t already have any OAuth applications associated with your organization on GitHub, you’ll be told there are No Organization Owned Applications. Otherwise, you’ll see a list of the OAuth applications already connected to your account.
Registering a New OAuth Application
Click the Register a new application button to continue.
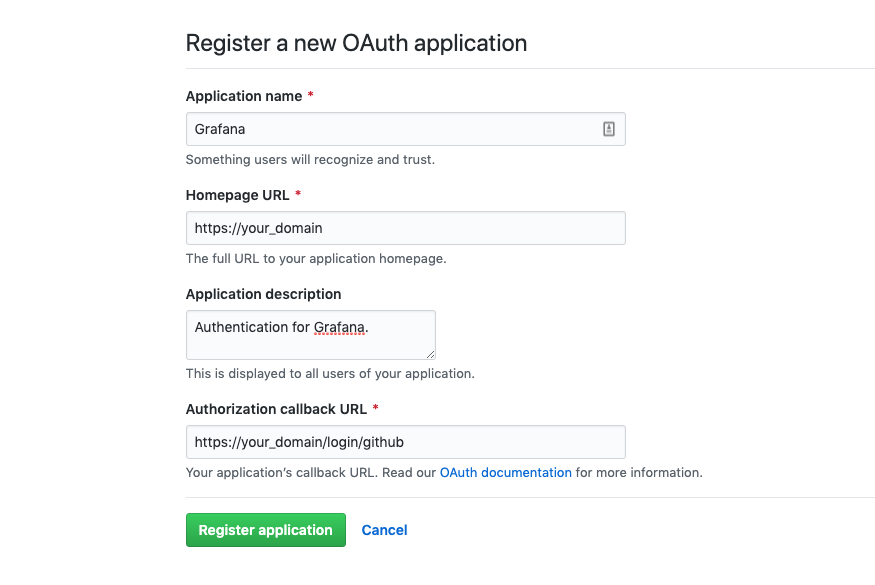
On the next screen, fill in the following details about your Grafana installation:
- Application name: This helps you distinguish your different OAuth applications from one another.
- Homepage URL: This tells GitHub where to find Grafana. Type
https://your_domaininto this field, replacingyour_domainwith your actual domain. - Application Description: This provides a description of your OAuth application’s purpose.
- Application callback URL: This is the address where users will be sent once successfully authenticated. For Grafana, this field must be set to
https://your_domain/login/github.
Keep in mind that Grafana users logging in through GitHub will see the values you entered in the first three preceding fields, so be sure to enter something meaningful and appropriate.
Completing the OAuth Registration
When completed, the form will look something like this:
 Click the Register application button.
You will now be redirected to a page containing the Client ID and Client Secret associated with your new OAuth application. Make note of both values, because you will need to add them to Grafana’s main configuration file to complete the setup.
Warning: Make sure to keep your Client ID and Client Secret in a secure and non-public location, because they could be used as the basis of an attack.
With your GitHub OAuth application created, you’re now ready to reconfigure Grafana to use GitHub for authentication.
(Optional) Step 6 — Configuring Grafana as a GitHub OAuth App
To complete GitHub authentication for your Grafana setup, you will now make some changes to your Grafana configuration files.
To begin, open the main Grafana configuration file:
sudo nano /etc/grafana/grafana.iniLocate the [auth.github] heading, and uncomment this section by removing the ; at the beginning of every line except ;allowed_domains = and ;team_ids =, which will not be changed in this tutorial.
Next, make the following changes:
- Set
enabledandallow_sign_uptotrue. This will enable GitHub Authentication and permit members of the allowed organization to create accounts themselves. Note that this setting is different from the allow_sign_up property under [users] that you changed in Step 4. - Set
client_idandclient_secretto the values you got while creating your GitHub OAuth application. - Set
allowed_organizationsto the name of your organization to ensure that only members of your organization can sign up and log in to Grafana..
The complete configuration will look like this:
/etc/grafana/grafana.ini
...
[auth.github]
enabled = true
allow_sign_up = true
client_id = your_client_id_from_github
client_secret = your_client_secret_from_github
scopes = user:email,read:org
auth_url = https://github.com/login/oauth/authorize
token_url = https://github.com/login/oauth/access_token
api_url = https://api.github.com/user
;allowed_domains =
;team_ids =
allowed_organizations = your_organization_name
...
To complete the setup, enable redirects behind a reverse proxy by setting a root_url value under the [server] heading.
/etc/grafana/grafana.ini
...
[server]
root_url = https://your_domain
...
Save your configuration and close the file.
Then, restart Grafana to activate the changes:
sudo systemctl restart grafana-serverLastly, verify that the service is up and running:
sudo systemctl status grafana-serverTesting GitHub Authentication
Navigate to https://your_domain. If you are already logged in to Grafana, hover your mouse over the avatar in the lower left corner of the screen and click Sign out.
On the login page, you’ll see a new section with a Sign in with GitHub button.
Click on the button to be redirected to GitHub, sign in, and confirm your intention to authorize Grafana.
Note: Ensure that your GitHub account is a member of your approved organization. If not, you’ll see a "Login Failed" message.
You will now be logged in with your existing Grafana account. If a Grafana account doesn’t already exist for the user you logged in as, Grafana will create a new user account with Viewer permissions, ensuring that new users can only use existing dashboards.
Configuring Default User Permissions
To change the default permissions for new users, open the main Grafana configuration file for editing:
sudo nano /etc/grafana/grafana.iniLocate the auto_assign_org_role directive under the [users] heading and uncomment it.
Set the directive to one of the following values:
- Viewer: can only use existing dashboards.
- Editor: can use, modify, and add dashboards.
- Admin: has full permissions.
This tutorial sets it to Viewer:
/etc/grafana/grafana.ini
...
[users]
...
auto_assign_org_role = Viewer
...
Save the file and restart Grafana:
sudo systemctl restart grafana-serverCheck the service’s status:
sudo systemctl status grafana-serverLike before, the status will read active (running).
At this point, you have fully configured Grafana to allow members of your GitHub organization to register and use your Grafana installation.
Conclusion
In this tutorial, you installed, configured, and secured Grafana. You also enabled authentication through GitHub for your organization.
To extend your Grafana setup, explore the official and community-built dashboards and plugins. For more information, visit the official Grafana documentation.
Test your setup on ccloud³
Sign up for ccloud³ and receive €200 starting credit for your project.